Collecting All the Data
I set up influxdb a while back on my NUC, so that I could have a TIG (Telegraf/Influxdb/Grafana) stack running and capture nice metrics on my home network. What I didn’t find out until later is that you shouldn’t put Influxdb on a network drive, it generated a network storm, maxing out my NUC’s CPU waiting on I/O operations to complete. I tore down the TIG stack and hadn’t used it since. That was about a year ago and I thought it was time to revisit the whole idea.
So first I re-enabled the influxdb instance in my Ansible playbook:
- name: Run the influxdb container
  become: yes
  docker_container:
    name: influxdb
    image: influxdb
    restart_policy: always
    volumes:
      - '{{ influxdb_root_dir }}/data:/var/lib/influxdb'
      - '{{ influxdb_root_dir }}/config/influxdb.conf:/etc/influxdb/influxdb.conf:ro'
    ports:
      - '8086:8086'
    labels:
      traefik.frontend.rule: 'Host:influxdb.{{ internal_domain }}'
      traefik.frontend.entryPoints: 'https'
    networks:
      - name: '{{ traefik_network }}'
    pull: '{{ docker_pull }}'
    recreate: '{{ docker_recreate }}'
I made sure that the influxdb_root_dir was not on the NAS this time round, so that all the data is stored locally1. I ran this for a couple of hours before I re-enabled the Telegraf instances running on the various Raspberry Pis on my network. This time I wanted to take extra care to prevent another network storm, so googled a bit and found this useful bit in the Influxdb config file:
wal-fsync-delay = "100ms"This helps with write contention to the disk and batches up multiple calls to write to the disk (which is slow).
Then is was just a matter of setting up the Grafana instance again and using influxdb as a source.
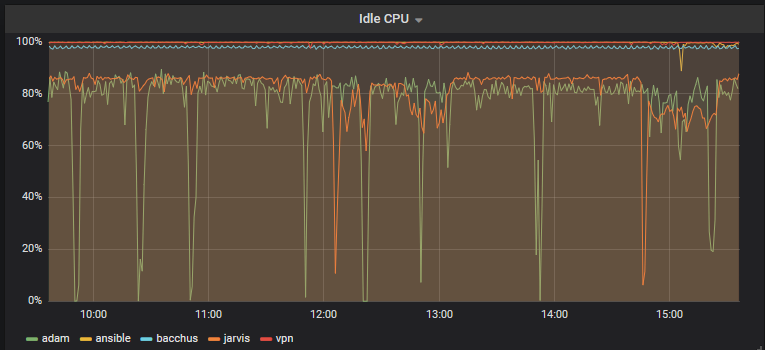
CPU stats for my Pis
Eventually, I want to re-enable collecting all my Home Assistant data as well as all the stats in Tautulli (and anything else I can think of).
-
Memo to me: Set up a backup process ↩︎